Check the residence patches from one tag during one tide
Source:R/fun_check_res_patch.R
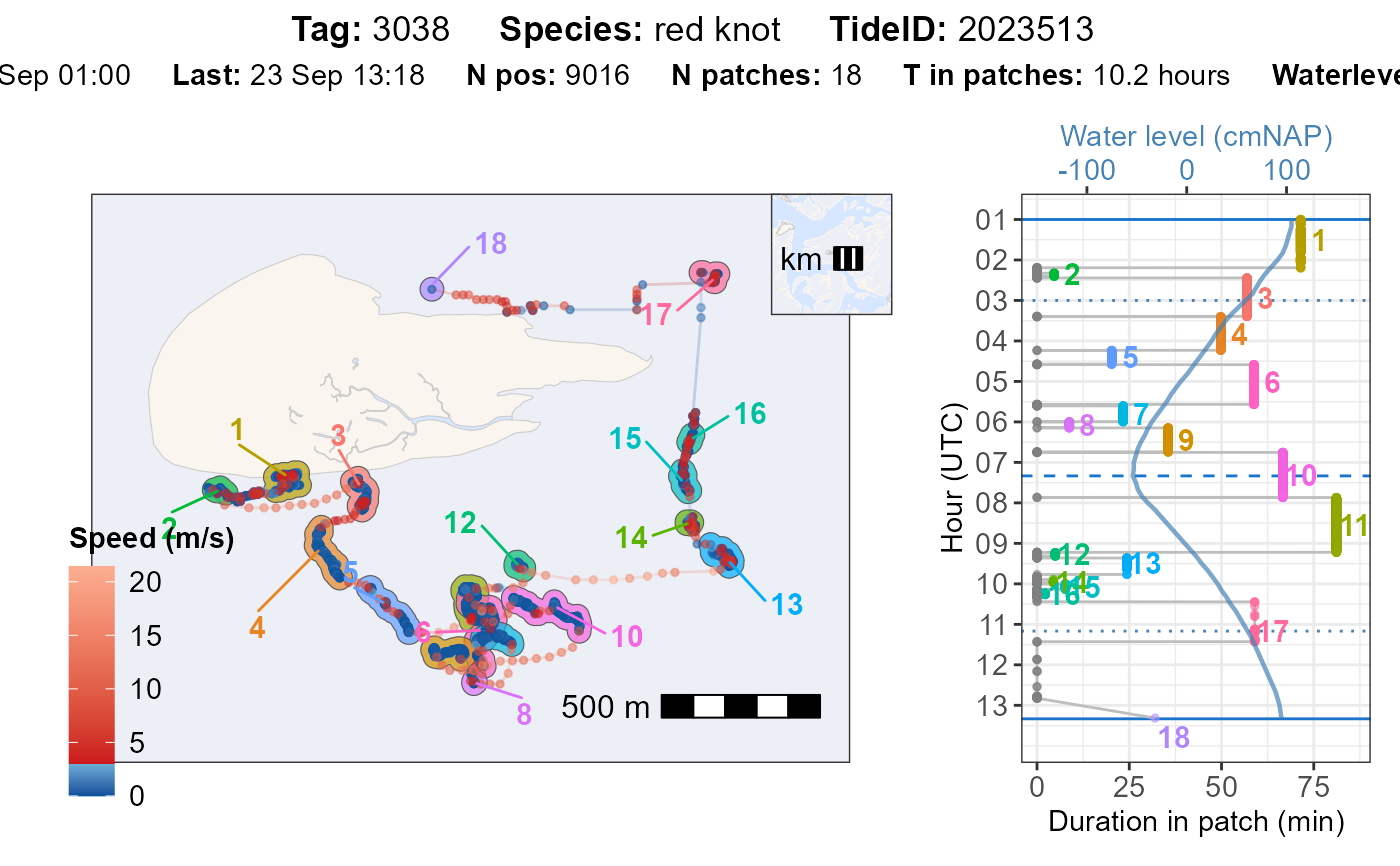
atl_check_res_patch.RdGenerates a ggplot2 showing bird residence patches per tideID, including
movement paths, patch durations, and an inset overview map.
Usage
atl_check_res_patch(
  data,
  tide_data,
  tide_data_highres,
  tide,
  offset = 0,
  waterlevel_min = -150,
  waterlevel_max = 150,
  waterlevel_line = 60,
  buffer_res_patches,
  buffer_bm = 250,
  buffer_overview = 10000,
  speed_threshold = 3,
  point_size = 1,
  point_alpha = 0.5,
  path_linewidth = 0.5,
  path_alpha = 0.2,
  patch_label_size = 4,
  patch_label_padding = 1,
  patch_alpha = 0.7,
  element_text_size = 11,
  water_fill = "#D7E7FF",
  water_colour = "grey80",
  land_fill = "#faf5ef",
  land_colour = "grey80",
  mudflat_colour = "#faf5ef",
  mudflat_fill = "#faf5ef",
  mudflat_alpha = 0.6,
  roosts = FALSE,
  filename = NULL,
  png_width = 3840,
  png_height = 2160
)
Arguments
- data
A
data.tablecontaining tracking data of one tag. Must include the columns:tag,x,y,time,datetime, andspeciesandpatch, as created byatl_res_patch().- tide_data
Data on the timing (in UTC) of low and high tides.
- tide_data_highres
Data on the timing (in UTC) of the waterlevel in small intervals (e.g. every 10 min) as provided from Rijkwaterstaat.
- tide
Tide ID to subset.
- offset
The offset in minutes between the location of the tidal gauge and the tracking area. This value will be added to the timing of the water data.
- waterlevel_min
Numeric in cmNAP. Minimum water level to fix the axis, if NA (default) it uses the minimum of the provided water level data. water level to the duration range (default: NA, which uses the minimum of the provided water level data).
- waterlevel_max
Numeric in cmNAP. Maximum water level to fix the axis, if NA (default) it uses the minimum of the provided water level data.
- waterlevel_line
Numeric in cmNAP. The water level to add as a dotted line to the plot (default: 60 cmNAP).
- buffer_res_patches
A numeric value (in meters) specifying the buffer around the polygon of each residence patch. If set to half of
lim_spat_indepof the residence patch calculation it reflects the distance used to determine spatial independence of patches.- buffer_bm
Map buffer size (default: 250).
- buffer_overview
Overview map buffer size (default: 10000).
- speed_threshold
Speed threshold in m/s for colour scale of movement speed (default: 3 m/s).
- point_size
Size of plotted points (default: 1).
- point_alpha
Transparency of points (default: 0.5).
- path_linewidth
Line width of movement paths (default: 0.5).
- path_alpha
Transparency of movement paths (default: 0.2).
- patch_label_size
Font size for patch labels (default: 4).
- patch_label_padding
Padding for patch labels (default: 1).
- patch_alpha
Alpha for patch polygons (default: 0.7).
- element_text_size
Font size for axis and legend text (default: 11).
- water_fill
Water fill (default "#D7E7FF")
- water_colour
Water coulour (default "grey80")
- land_fill
Land fill (default "#faf5ef")
- land_colour
Land colour (default "grey80")
- mudflat_colour
Mudflat colour (default "#faf5ef")
- mudflat_fill
Mudflat fill (default "#faf5ef")
- mudflat_alpha
Mudflat alpha (default 0.6)
- roosts
Logical. Whether to add the roost polygon around Griend or not (default: FALSE).
- filename
Character (or NULL). If provided, the plot is saved as a
.pngfile to this path and with this name; otherwise, the function returns the plot.- png_width
Width of saved PNG (default: 3840).
- png_height
Height of saved PNG (default: 2160).
Examples
# packages
library(tools4watlas)

# load example data
data <- data_example

# load example tide pattern and waterlevel data
tidal_pattern_fp <- system.file(
  "extdata", "example-tidalPattern-west_terschelling-UTC.csv",
  package = "tools4watlas"
)
measured_water_height_fp <- system.file(
  "extdata", "example-gemeten_waterhoogte-west_terschelling-clean-UTC.csv",
  package = "tools4watlas"
)
tidal_pattern <- fread(tidal_pattern_fp, yaml = TRUE)
measured_water_height <- fread(measured_water_height_fp)

# calculate residence patches for one red knot
data <- atl_res_patch(
  data[tag == "3038"],
  max_speed = 3, lim_spat_indep = 75, lim_time_indep = 180,
  min_fixes = 3, min_duration = 120
)

# plot example
atl_check_res_patch(
  data[tag == "3038"],
  tide_data = tidal_pattern, tide_data_highres = measured_water_height,
  tide = "2023513", offset = 30,
  buffer_res_patches = 75 / 2
)